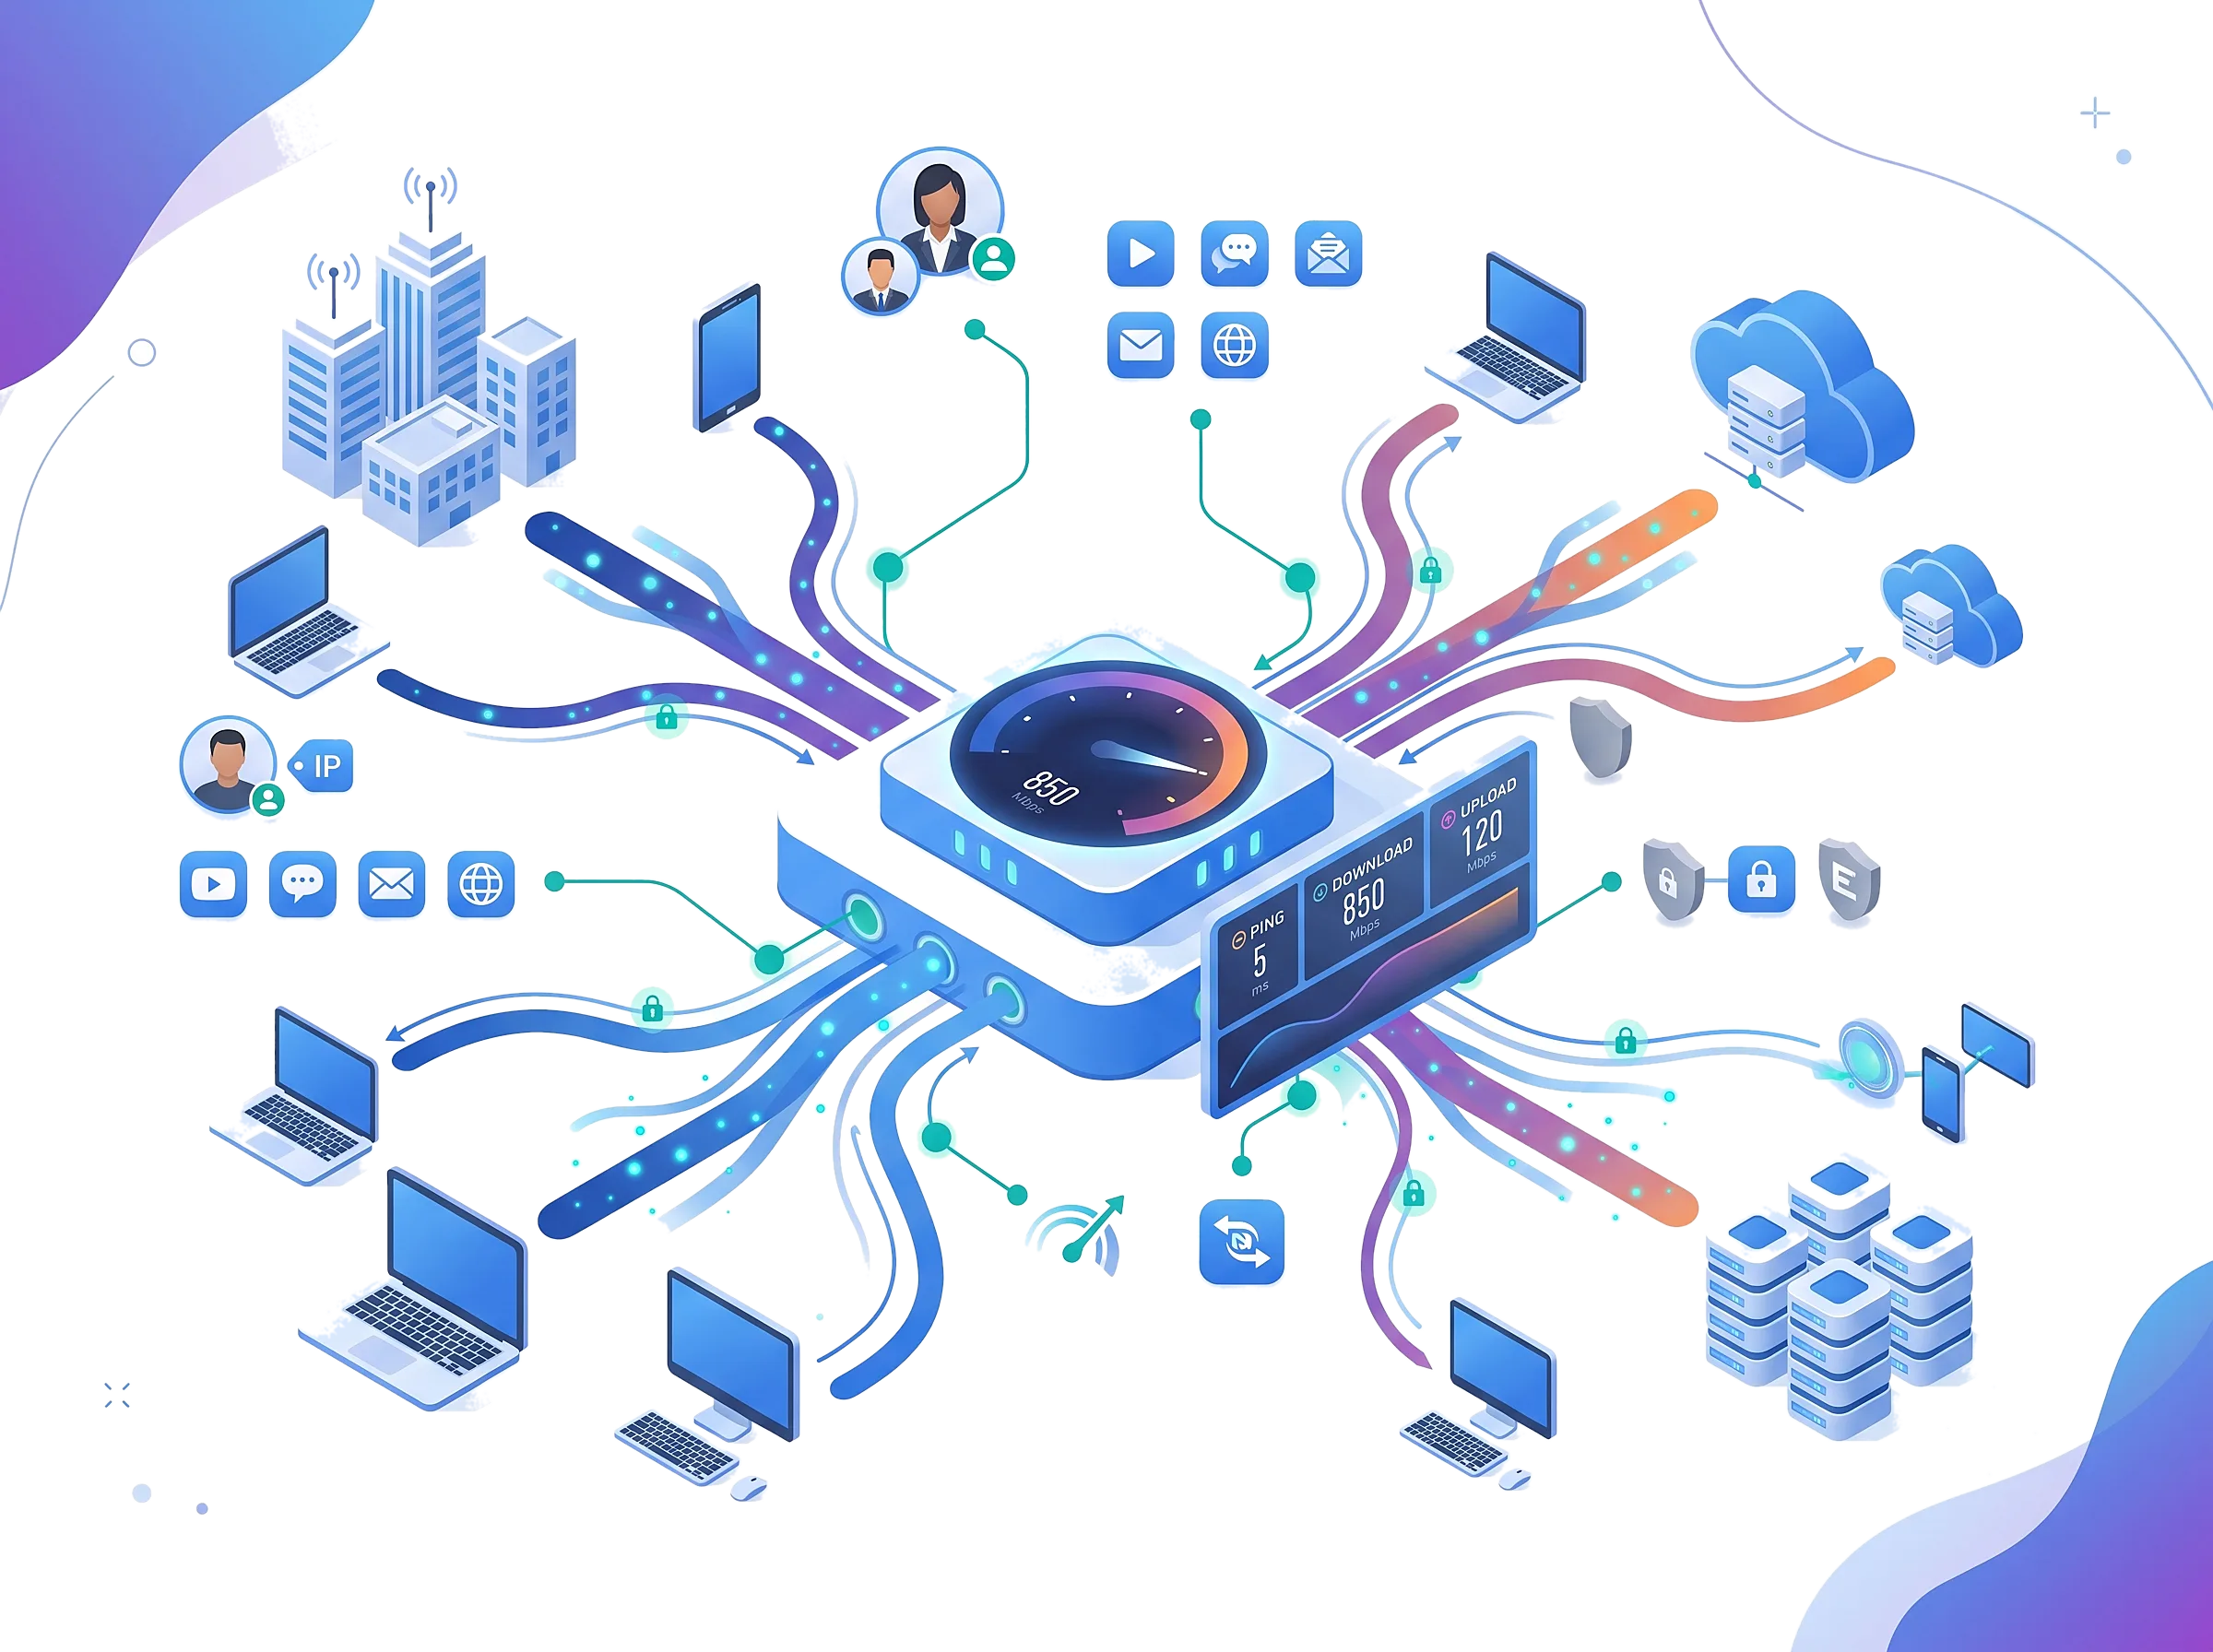
Real-Time Traffic, Real Data

FEATURED

Real-Time Traffic, Real Data

Standard monitoring tools only show the tip of the iceberg. Instead of delayed reports based on session ends; see exactly who, which application, or which rule is using the traffic right now. Get details that Netflow cannot provide.
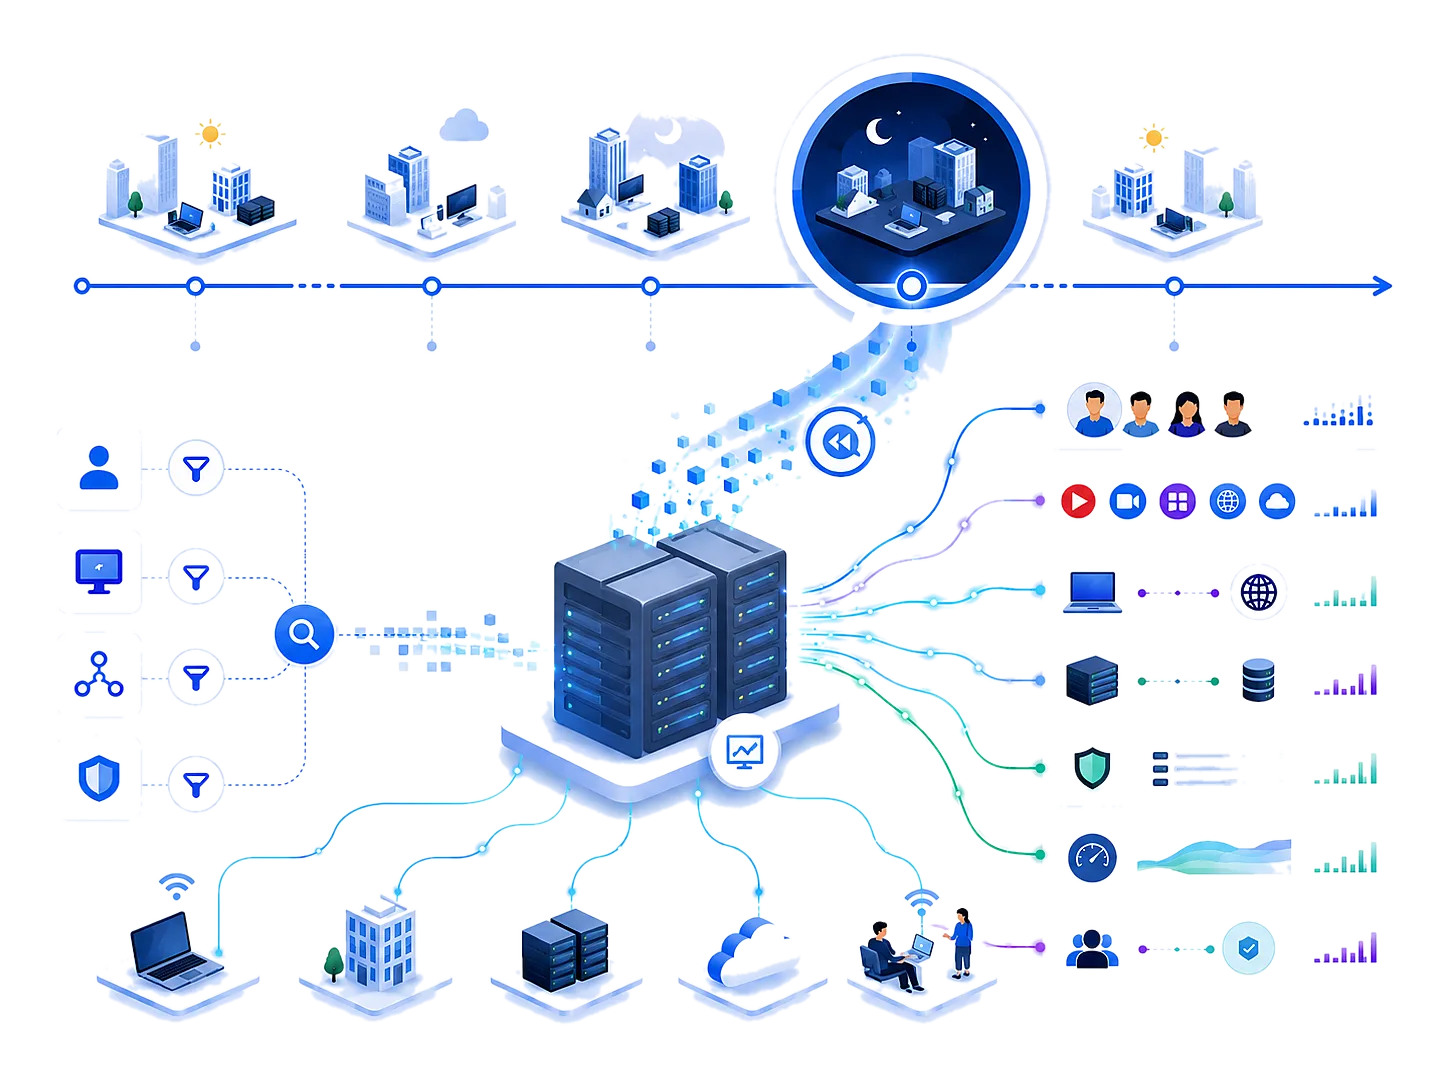

The Question "What Happened Last Night?" becomes History

DETAILS

The Question "What Happened Last Night?" becomes History

We illuminate not just the "now" but the past as well. Wondering why your internet line was saturated last night? Identify the source of the problem in seconds by querying historical data based on Source IP, Destination IP, User, and Application.
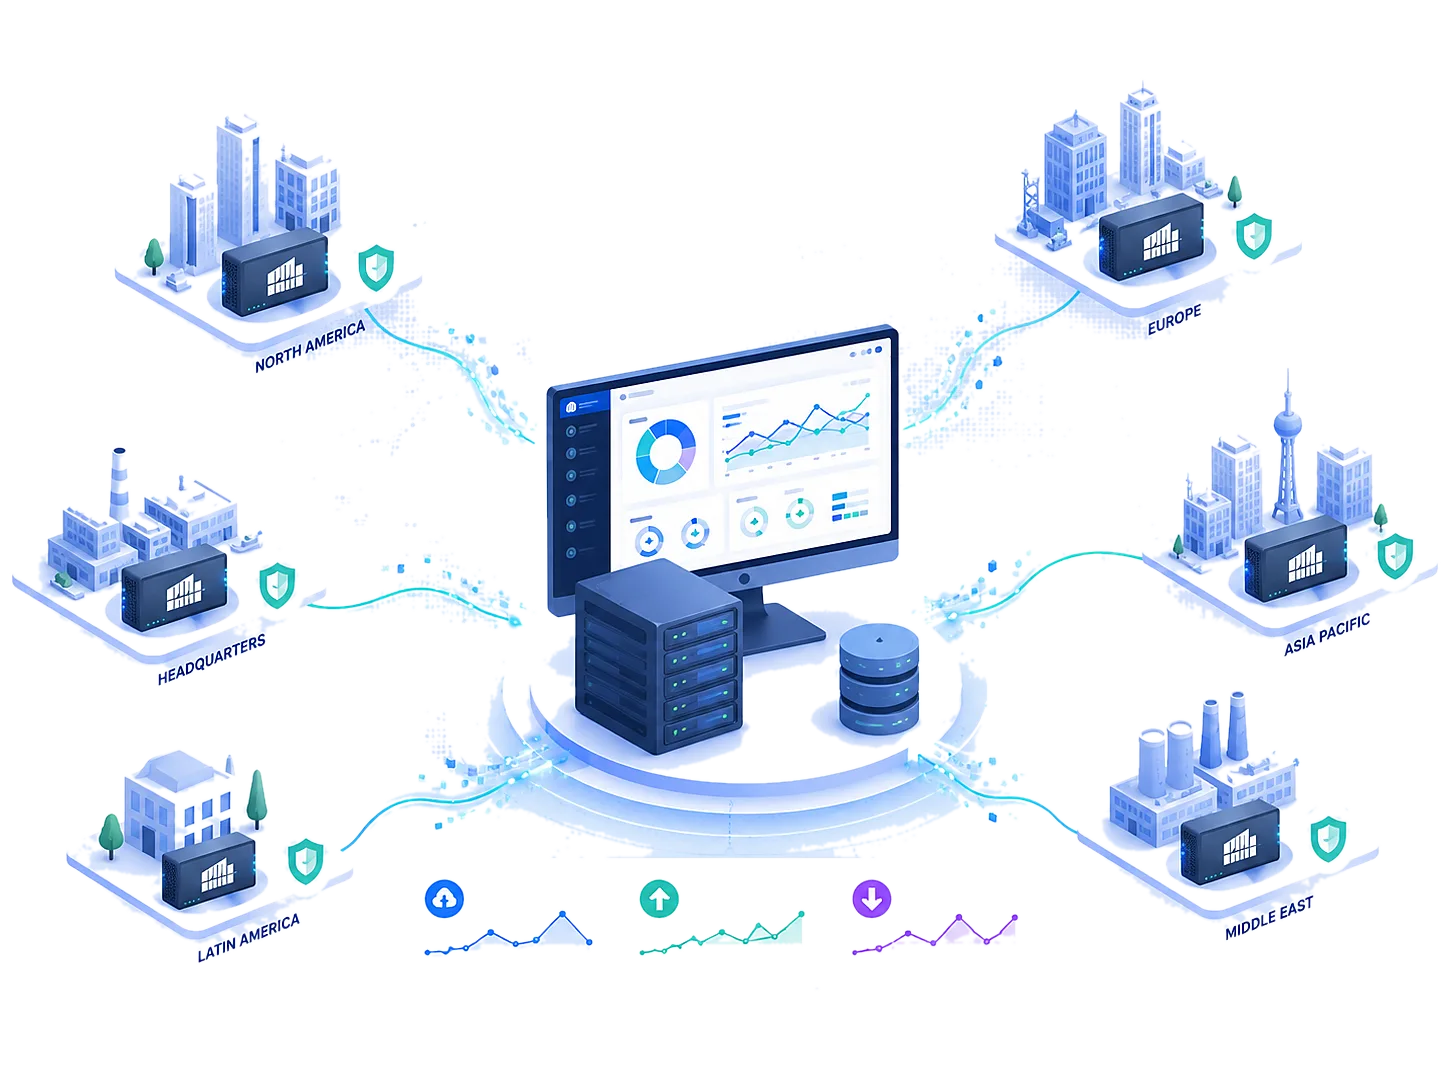

Master Your Entire Network from a Single Center

FEATURED

Master Your Entire Network from a Single Center

No matter how distributed your company structure is, you are in control. Monitor your Palo Alto firewalls located in multiple regions from a single software. Manage Total, Upload, and Download metrics at the interface level from a single screen.
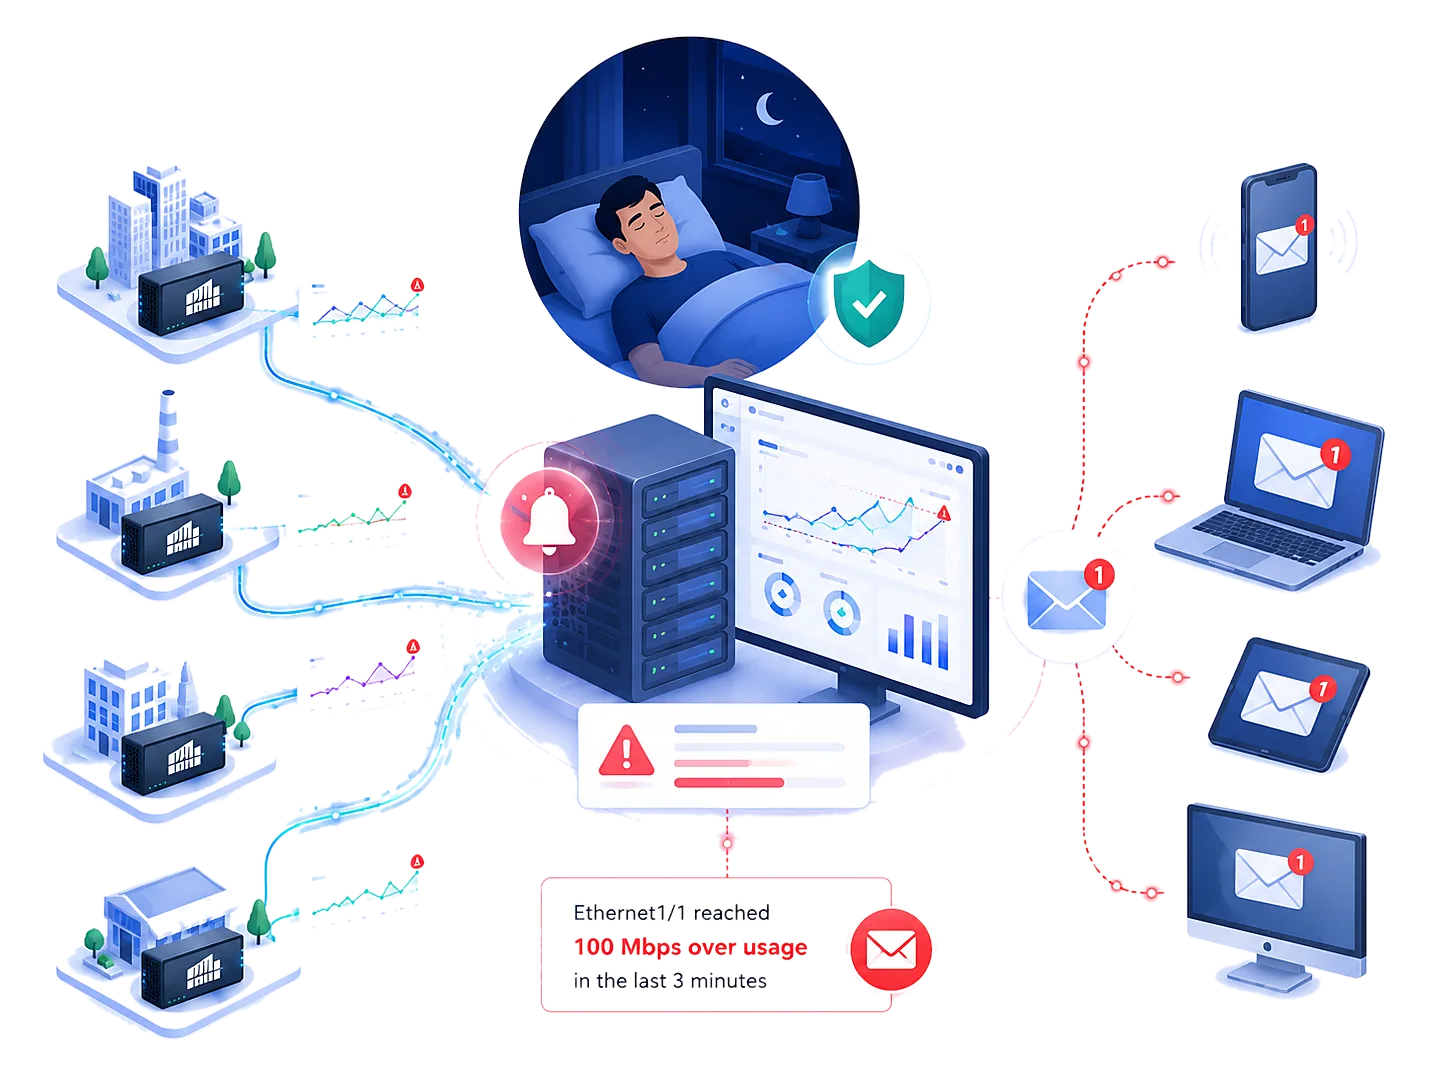

We Stand Guard While You Sleep

DETAILS

We Stand Guard While You Sleep

You don't have to monitor network traffic constantly. Our advanced alarm module notifies you instantly when your set thresholds are exceeded. For example, receive alerts like "Ethernet1/1 reached 100 Mbps over usage in the last 3 minutes".
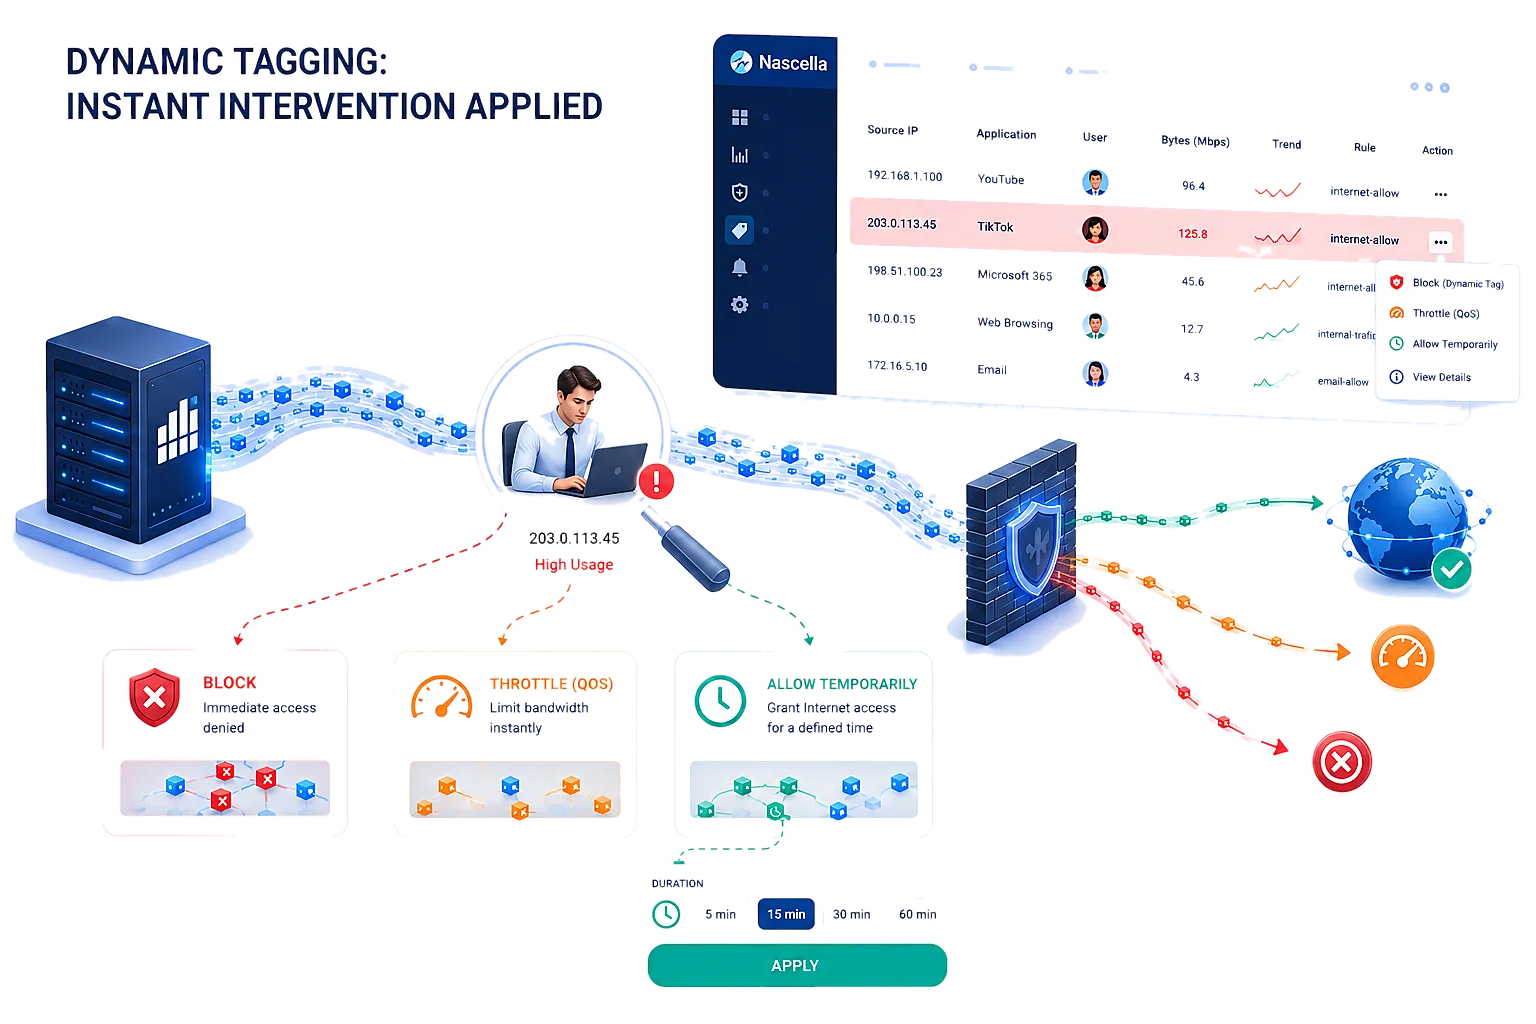

Don't Just Watch, Intervene

FEATURED

Don't Just Watch, Intervene

Detecting the problem isn't enough; you need to solve it. Nascella gives you the ability to intervene instantly in problematic traffic. Instantly block an IP address you select via Datagrid thanks to Dynamic Tagging.


Technical Requirements

Operating System

Windows 11 or
Windows Server 2016+

Notification

Microsoft Graph API or
SMTP Server

Firewall Integration

Palo Alto Networks NGFW
(XML API)

Database

Embedded SQLite
(no setup required)

Directory

Active Directory (LDAP)
only for AD sign-in

Frequently Asked Questions

What is Traffic Monitor?

Traffic Monitor monitors and reports traffic passing through Palo Alto Networks firewalls in real time. Within seconds it shows which user, IP address, application or security rule is using your internet line right now. It also offers historical queries, threshold alarms, daily PDF reports and the ability to act on problem traffic from the console.

How is it different from the firewall's own reports?

The firewall writes a traffic log when a session ends. So a download that runs all day appears in reports as if it happened in the last few minutes, and you cannot tell why the line is full right now. Traffic Monitor reads active sessions every 10 seconds by default and calculates each session's current speed (Mbps). You see who is generating traffic as it happens, before the session ends, and you can query the same data historically.

How is it different from NetFlow?

You do not need a NetFlow collector or a NetFlow profile on the firewall; data comes directly from the firewall's API. Every session includes the user, application, security rule, source/destination IP and interface. This lets you report many details that NetFlow profiles do not provide, both in real time and historically.

Which devices are supported? Does it work through Panorama?

Palo Alto Networks NGFWs (hardware appliances and VM-Series) are supported. Because live session data is read directly from the firewall, a connection to an NGFW is required; it does not work through Panorama. In high-availability (HA) deployments, both devices are defined together.

What do I need to install it? Is a separate database server required?

No. Traffic Monitor installs as a service on a Windows server and comes with a web console. It uses an embedded SQLite database, so no separate database server or extra configuration is needed. Nothing is installed on endpoints. Monitoring starts as soon as you enter the firewall address and API user.

Does it put load on the firewall?

Traffic Monitor creates a low load on the firewall's management plane; it does not touch the data plane that processes traffic and does not affect device performance. The polling interval is 10 seconds by default and can be shortened or extended as needed.

Which permissions are required on the firewall?

The Operational Requests XML API permission is enough; active sessions, interface counters and IP-to-user mappings are read with it. If you use the dynamic tagging feature, the User-ID Agent permission is also required. Web UI, command line (CLI) and REST API access are not required.

What data can I see?

You can see all active sessions and the top source IPs, destinations, applications, security rules and users generating traffic. Current, average and peak speed (Mbps) are calculated for every session. Upload, download and total usage per interface are tracked with real-time charts, and the dashboard brings all of this together on one page.

Can I see traffic by user name?

Yes. Traffic Monitor reads the User-ID IP-to-user mappings on the firewall and shows sessions with user names. User-ID must be configured on your firewall.

Can I find out why the line was full last night?

Yes. Data is stored per minute, so you can run historical queries by source IP, destination IP, user, application and rule to see who filled the line at a specific time. Data is kept for 30 days by default, and this period can be changed.

Can I monitor multiple locations?

Yes. Add the Palo Alto firewalls in different regions as sites and monitor them all from a single installation. Each user sees charts in their own time zone.

How do threshold alarms work?

You set a threshold in Mbps for a source IP, destination IP, application, security rule, user or interface (total, upload, download), and how long it must be exceeded (3–1440 minutes). For example: "ethernet1/1 exceeded 100 Mbps for the last 3 minutes". Emails are sent when the threshold is exceeded, at intervals you choose while it continues, and when it returns to normal. Alarms can be limited to specific applications, interfaces, rules, users and IP blocks (subnet or single IP), with exclusion lists. Email language and content can be customized.

Can I get automated reports?

Yes. Daily PDF reports are generated and sent by email. There are three report types: a summary of top applications, rules, source IPs and similar with tables and charts; 24-hour line charts of the same data; and a detailed report for a specific analysis (e.g. the IP addresses using a given application the most).

Can I act on problem traffic from the console?

Yes, with dynamic tagging. When you tag an IP address selected from the session list, you can give that IP time-limited internet access or slow down its internet speed within seconds, without a commit on the firewall. This requires rules written in advance on the firewall for the Dynamic Address Groups that use these tags. The tag is removed automatically when its time expires, and you can also clear the IP's existing sessions. All tagging actions are kept in a history log.

Where is the data stored?

All data stays on the server where Traffic Monitor is installed; nothing is sent to Nascella or any third-party cloud.

Who can access the console, and how?

Console users can sign in with local accounts; if you want sign-in with Active Directory accounts, you define an LDAP connection. Sign-ins can be protected with two-factor authentication using an authenticator app. Language and time zone are set per user.

Is there a desktop application?

Yes, there is also a Windows desktop application for watching live charts. However, it collects data only while it is open, and every administrator who opens it sends their own queries to the firewall, multiplying the load. For continuous data collection, historical queries, alarms and multiple administrators, we recommend the server (web) edition.

Is there a free trial?

Yes, we offer a 30-day trial. Request it with your corporate email address using the form on the product page; once approved, the download link is sent to your inbox.

How is Traffic Monitor licensed?

Traffic Monitor is licensed annually per site, priced by firewall model. A single site license covers two devices running as an HA pair. VM-Series firewalls are licensed according to the VM model.

Request Trial - Traffic Monitor

OUR MISSION

To provide pinpoint solutions to the challenges faced by System and Network administrators, driven by our field experience. With our privacy-first architecture, we transform technology from chaos into a strategic power.


© 2026 Nascella Teknoloji San. ve Tic. Ltd. Şti.

Kazimdirik Mah. 296/1 Sok. No:9 D:208, Bornova, Izmir, Turkiye · +90 232 332 0618

v1.0.0.35